The Complete Guide to Time Series Models
Explore definitions, real-world use cases and example models
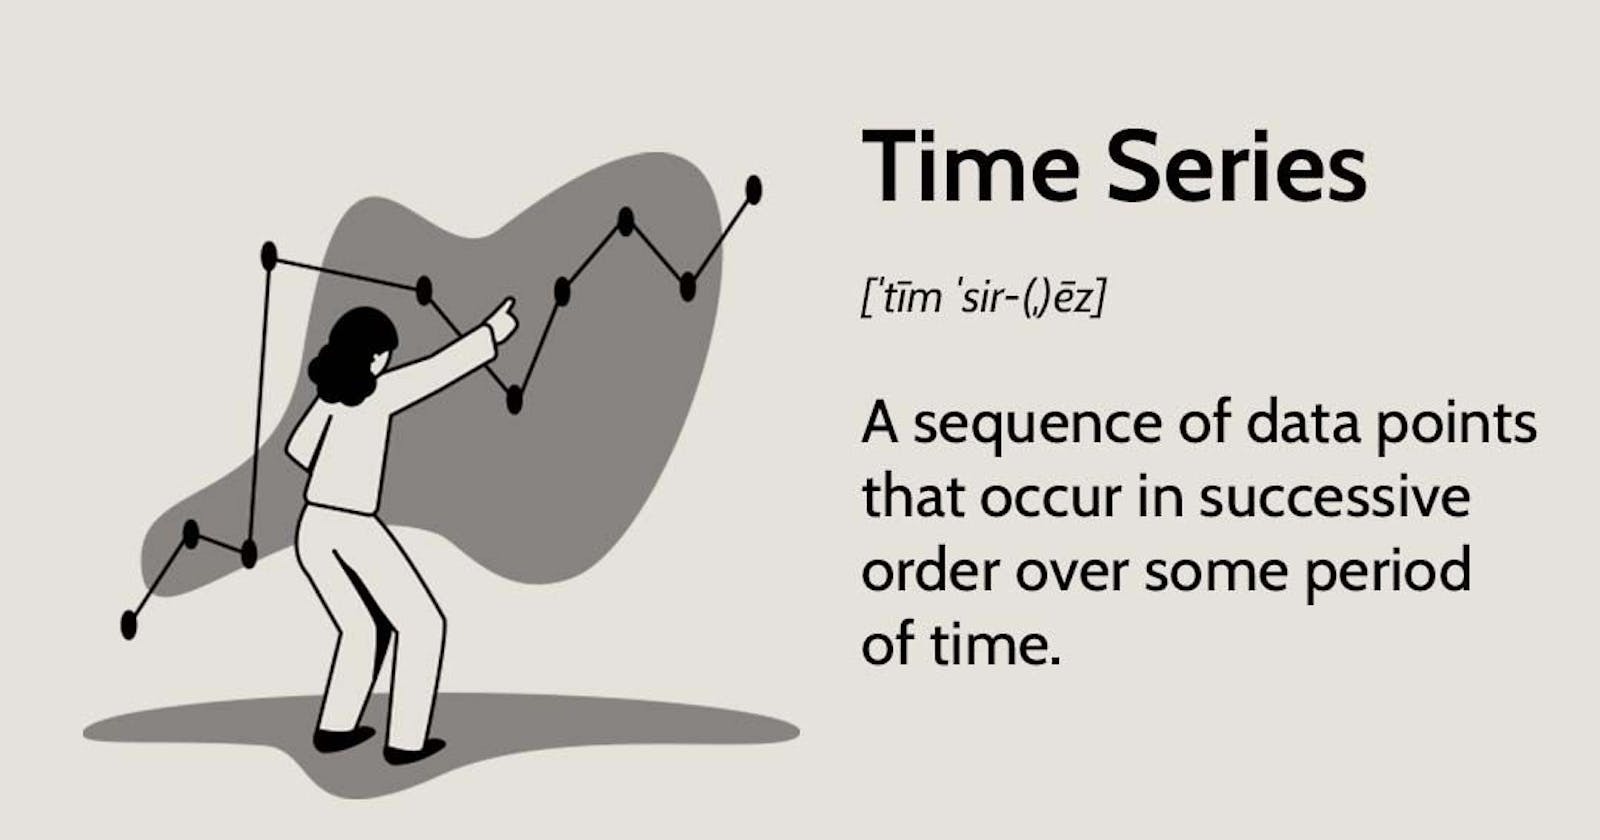
A time series model is a statistical tool that is used to make predictions based on time-series data. Typically, you would want to:
explore past trends
understand present conditions
predict future outcomes.
Time-series data is data collected on equally-spaced intervals i.e., daily, monthly, weekly, yearly etc. Common examples include:
stock prices
weather data
sales data
Essentials of Time Series Models
1. Components of Time Series Data
Before diving into the modeling magic, let's understand the fundamental components of time series data:
Trend: The long-term movement of the data. Imagine the upward trend in smartphone sales over the years.
Seasonality: Regular, predictable patterns within the data. Think of the spikes in ice cream sales every summer.
Cyclic Behavior: Repeating but not strictly periodic fluctuations, like the economic cycles of boom and bust.
Irregularity (or Noise): Unpredictable fluctuations or random events, such as sudden stock market crashes.
2. White Noise - The Random Touch
Imagine you're trying to predict the temperature in your city for tomorrow. However, every time you check, the recorded temperature is completely random - no patterns, no trends, just chaos. This randomness is known as white noise. In time series modeling, we aim to remove this "noise" to uncover meaningful patterns.
3. Autocorrelation - Learning from the Past
Autocorrelation is like finding a friend in your data - it's about a variable's correlation with its past self. For instance, today's stock price might be related to yesterday's.
Real-world Examples
You are a savvy investor looking to put your money in a profitable stock portfolio. You ingest past data and apply an autoregressive integrated moving average (ARIMA) model to uncover patterns and forecast future price movements. You discover that stock prices typically rebound after a decline, so you buy low, ride the surge, and capitalize on high returns.
You are a meteorologist tasked with weather forecasting. Armed with a seasonal trend model (STL), you collect extensive historical weather data, including temperature, humidity, wind speed, and other variables. You feed the data into the model. The model gives an output broken down into:
Trend Component
Seasonal Component
Remainder Component
With the trend component, you find a statistically significant upward trend in temperatures, indicating a warming climate. So you forward this to officials at the Ministry of Agriculture to plan for potential shifts in agriculture and ecosystems due to the warming trend. With the seasonal component, you predict the coming of rains. You therefore give weather advisories to help the public prepare for the conditions. Using the remainder component, you identify weather patterns that can't be explained by the season or trend. You monitor these patterns and prepare for unforeseen weather events.
You are a salesman. You run a retail store. Your promotion is dependent on you accurately predicting. Armed with the Prophet Times series model from Facebook, you feed it data and predict how many raincoats you will sell.
Exploratory Data Analysis (EDA) for Time Series
The first step for Exploratory Data Analysis is to visualize the time series data. The x-axis will represent time and the y-axis the data you are measuring.
The next step is to identify patterns. They may, for example, indicate: increasing sales, declining temperatures, or evolving stock prices. Commonly used visual tools include:
Line Charts: use a line chart to visualize how a company's stock price has evolved over the past year
Heat Maps: visualize changes in temperature or rainfall over time
Pandas Profiling: you have a dataset that contains daily stock prices for a particular company over several years. With a few lines of code, you generate a report containing the following insights:
Summary statistics for each time-series column, such as count, mean, standard deviation, minimum, and maximum.
Data types and unique values in each column.
A line chart showing the evolution of stock prices over time.
Correlations between stock prices and potentially related variables.
Box Plots: visualize the variability in stock prices for each month using a box plot
There are other visual tools, more than we can cover in a single article.
After identifying patterns, you can now draw insights.
Examples of Time-Series Models
1. Autoregressive Integrated Moving Average (ARIMA)
ARIMA models are among the most widely used time series forecasting techniques. They combine autoregression, differencing, and moving average components to model a time series
2. Exponential Smoothing
Exponential smoothing is a family of time series models that use a weighted average of past observations to forecast future values. The weights decrease exponentially as the observations get older
3. Seasonal Autoregressive Integrated Moving Average (SARIMA)
SARIMA is an extension of the ARIMA model that takes into account seasonal patterns in the data. It is used when the time series exhibits seasonal patterns along with trends and cycles
4. Vector Autoregression (VAR)
VAR models are used when there are multiple time series that are interrelated and influence each other. They model the relationships between the variables and can be used to forecast future values of each variable
5. Long Short-Term Memory (LSTM)
LSTM is a type of recurrent neural network that is used for time series modeling. It is particularly useful for modeling complex relationships between variables and can be used for both univariate and multivariate time series
6. Prophet
Prophet is a time series forecasting library developed by Facebook. It is designed to be easy to use and can handle seasonality, trends, and holidays in the data
These are just but a few common models. Some of them we have explored in a previous section with examples.
Summary
Analyze trends, forecast the future, and understand the present. Familiarize with the core elements of time series data like trends, seasonality, and white noise. Explore data with easy-to-use tools like line charts, heat maps, and pandas profiling. Discover popular models like ARIMA, Prophet and apply them in your domain area of expertise.
